|
Thermo Fisher
gene exp mmp14 hs01037003 g1 Gene Exp Mmp14 Hs01037003 G1, supplied by Thermo Fisher, used in various techniques. Bioz Stars score: 98/100, based on 1 PubMed citations. ZERO BIAS - scores, article reviews, protocol conditions and more https://www.bioz.com/result/gene exp mmp14 hs01037003 g1/product/Thermo Fisher Average 98 stars, based on 1 article reviews
gene exp mmp14 hs01037003 g1 - by Bioz Stars,
2026-05
98/100 stars
|
Buy from Supplier |
|
Sino Biological
human h timp1  Human H Timp1, supplied by Sino Biological, used in various techniques. Bioz Stars score: 91/100, based on 1 PubMed citations. ZERO BIAS - scores, article reviews, protocol conditions and more https://www.bioz.com/result/human h timp1/product/Sino Biological Average 91 stars, based on 1 article reviews
human h timp1 - by Bioz Stars,
2026-05
91/100 stars
|
Buy from Supplier |
|
Thermo Fisher
gene exp spp1 mm00436767 m1 Gene Exp Spp1 Mm00436767 M1, supplied by Thermo Fisher, used in various techniques. Bioz Stars score: 99/100, based on 1 PubMed citations. ZERO BIAS - scores, article reviews, protocol conditions and more https://www.bioz.com/result/gene exp spp1 mm00436767 m1/product/Thermo Fisher Average 99 stars, based on 1 article reviews
gene exp spp1 mm00436767 m1 - by Bioz Stars,
2026-05
99/100 stars
|
Buy from Supplier |
|
R&D Systems
recombinant human timp1  Recombinant Human Timp1, supplied by R&D Systems, used in various techniques. Bioz Stars score: 93/100, based on 1 PubMed citations. ZERO BIAS - scores, article reviews, protocol conditions and more https://www.bioz.com/result/recombinant human timp1/product/R&D Systems Average 93 stars, based on 1 article reviews
recombinant human timp1 - by Bioz Stars,
2026-05
93/100 stars
|
Buy from Supplier |
|
Thermo Fisher
gene exp abcb1a mm00440761 m1 Gene Exp Abcb1a Mm00440761 M1, supplied by Thermo Fisher, used in various techniques. Bioz Stars score: 91/100, based on 1 PubMed citations. ZERO BIAS - scores, article reviews, protocol conditions and more https://www.bioz.com/result/gene exp abcb1a mm00440761 m1/product/Thermo Fisher Average 91 stars, based on 1 article reviews
gene exp abcb1a mm00440761 m1 - by Bioz Stars,
2026-05
91/100 stars
|
Buy from Supplier |
|
Thermo Fisher
gene exp 18s hs03003631 g1 Gene Exp 18s Hs03003631 G1, supplied by Thermo Fisher, used in various techniques. Bioz Stars score: 90/100, based on 1 PubMed citations. ZERO BIAS - scores, article reviews, protocol conditions and more https://www.bioz.com/result/gene exp 18s hs03003631 g1/product/Thermo Fisher Average 90 stars, based on 1 article reviews
gene exp 18s hs03003631 g1 - by Bioz Stars,
2026-05
90/100 stars
|
Buy from Supplier |
|
Thermo Fisher
gene exp abcg1 mm00437390 m1 Gene Exp Abcg1 Mm00437390 M1, supplied by Thermo Fisher, used in various techniques. Bioz Stars score: 97/100, based on 1 PubMed citations. ZERO BIAS - scores, article reviews, protocol conditions and more https://www.bioz.com/result/gene exp abcg1 mm00437390 m1/product/Thermo Fisher Average 97 stars, based on 1 article reviews
gene exp abcg1 mm00437390 m1 - by Bioz Stars,
2026-05
97/100 stars
|
Buy from Supplier |
|
Thermo Fisher
gene exp acta2 mm01546133 m1 Gene Exp Acta2 Mm01546133 M1, supplied by Thermo Fisher, used in various techniques. Bioz Stars score: 99/100, based on 1 PubMed citations. ZERO BIAS - scores, article reviews, protocol conditions and more https://www.bioz.com/result/gene exp acta2 mm01546133 m1/product/Thermo Fisher Average 99 stars, based on 1 article reviews
gene exp acta2 mm01546133 m1 - by Bioz Stars,
2026-05
99/100 stars
|
Buy from Supplier |
|
Thermo Fisher
gene exp hprt1 rn01527840 m1 Gene Exp Hprt1 Rn01527840 M1, supplied by Thermo Fisher, used in various techniques. Bioz Stars score: 99/100, based on 1 PubMed citations. ZERO BIAS - scores, article reviews, protocol conditions and more https://www.bioz.com/result/gene exp hprt1 rn01527840 m1/product/Thermo Fisher Average 99 stars, based on 1 article reviews
gene exp hprt1 rn01527840 m1 - by Bioz Stars,
2026-05
99/100 stars
|
Buy from Supplier |
|
OriGene
human timp 1 protein  Human Timp 1 Protein, supplied by OriGene, used in various techniques. Bioz Stars score: 90/100, based on 1 PubMed citations. ZERO BIAS - scores, article reviews, protocol conditions and more https://www.bioz.com/result/human timp 1 protein/product/OriGene Average 90 stars, based on 1 article reviews
human timp 1 protein - by Bioz Stars,
2026-05
90/100 stars
|
Buy from Supplier |
|
R&D Systems
monoclonal antibody  Monoclonal Antibody, supplied by R&D Systems, used in various techniques. Bioz Stars score: 91/100, based on 1 PubMed citations. ZERO BIAS - scores, article reviews, protocol conditions and more https://www.bioz.com/result/monoclonal antibody/product/R&D Systems Average 91 stars, based on 1 article reviews
monoclonal antibody - by Bioz Stars,
2026-05
91/100 stars
|
Buy from Supplier |
|
Thermo Fisher
gene exp acta1 mm00808218 g1 Gene Exp Acta1 Mm00808218 G1, supplied by Thermo Fisher, used in various techniques. Bioz Stars score: 95/100, based on 1 PubMed citations. ZERO BIAS - scores, article reviews, protocol conditions and more https://www.bioz.com/result/gene exp acta1 mm00808218 g1/product/Thermo Fisher Average 95 stars, based on 1 article reviews
gene exp acta1 mm00808218 g1 - by Bioz Stars,
2026-05
95/100 stars
|
Buy from Supplier |
Image Search Results
Journal: bioRxiv
Article Title: Network-based prioritisation and validation of novel regulators of vascular smooth muscle cell proliferation in disease
doi: 10.1101/2023.08.25.554834
Figure Lengend Snippet: (A) Predicted inputs to TIMP1 in the PrP GRN, coloured as described in left panel of . (B) Representative immunohistochemistry image for αSMA (blue) and TIMP1 (brown) in non-plaque human aorta (N=7), scale bar=500 µm (overview) and 100 µm (zoomed view). (C) Enrichment plots from gene set enrichment analysis (GSEA) for E2F targets (p adj = 0.005) and G2M checkpoint genes (p adj = 0.04) in bulk RNA-seq data from human VSMCs (hVSMCs) treated with 500 ng/mL recombinant human (rh) TIMP1 for 6 hours versus control cells (N=6 independent hVSMC isolates). (D) Proportion of EdU+ hVSMCs following 16 hours EdU incorporation in cells treated with 500 ng/mL rhTIMP1 or vehicle controls (CTRL), standardised to the average of all samples (N=6 independent hVSMC isolates). (E) Representative images of Myh11-Confetti VSMCs isolated from murine aortas and cultured for 21 days in the presence of vehicle control, 500 ng/mL recombinant murine TIMP1 or 2 ng/mL PDGF-BB. Scale bar=500 µm. (F, G) Quantification of number and size of clonally expanded patches of Confetti+ VSMCs over 21 days of culture. Statistical significance assessed via a generalised linear model, N=4 animals.
Article Snippet: Cells were treated with recombinant (r) murine (m) or
Techniques: Immunohistochemistry, RNA Sequencing Assay, Recombinant, Isolation, Cell Culture
Journal: bioRxiv
Article Title: Network-based prioritisation and validation of novel regulators of vascular smooth muscle cell proliferation in disease
doi: 10.1101/2023.08.25.554834
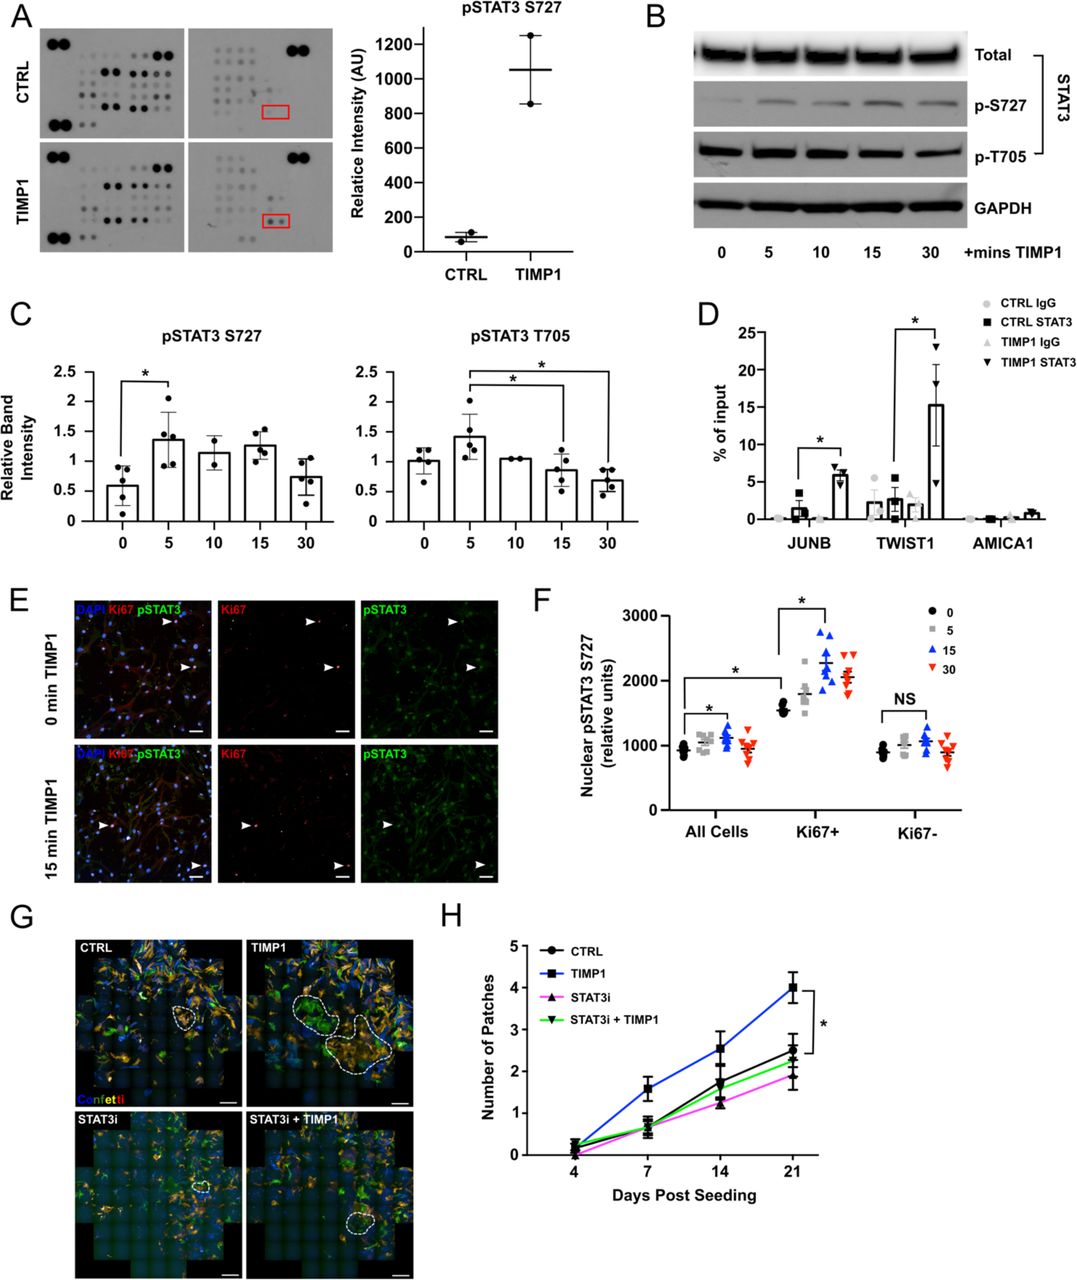
Figure Lengend Snippet: (A) Proteome profiler phosphokinase array of human VSMCs (hVSMCs) following 15 minutes treatment of 500 ng/mL recombinant human (rh) TIMP1 or vehicle control. Quantification of relative spot intensity by densitometry. (B) Western blot of total, pS727 and pT705 STAT3 in serum starved hVSMCs analysed 0, 5 10, 15 or 30 minutes after rhTIMP1 treatment. (N=5 hVSMC isolates). (C) Quantification of relative band intensity, normalised to total STAT3 levels (N=5 hVSMC isolates), statistical significance determined using ANOVA. (D) ChIP qPCR analysis of STAT3 binding at STAT3 targets ( TWIST and JUN ) and a negative control ( AMICA1 ) gene promoters, in serum starved control hVSMCs and 15 minutes following 500 ng/mL rhTIMP1 treatment. Graph shows anti-STAT3 and control IgG precipitated DNA as a percent of input. N=3 hVSMC isolates. (E) Representative images of STAT3 and Ki67 staining in serum starved control hVSMCs and after 15 mins 500 ng/mL rhTIMP1 treatment (N=3 hVSMC isolates analysed in triplicate). Arrowheads indicate KI67+ cells. Scale bar=50 µm. (F) Quantification of relative fluorescence intensity of nuclear pSTAT (S727) staining in panel E, for KI67+ and KI67-cells. (G) Representative images of VSMCs isolated from Myh11-Confetti aortas cultured 21 days in +/− 500 ng rhTIMP1 and/or 10 uM TT101 (N=6). Scale bar=500 µm. (H) Number and size of clonally expanded patches formed by lineage labelled VSMCs from Myh11-Confetti aortas, treated as indicated and imaged over 21 days. Q uantified using ImageJ. Statistical significance assessed via generalised linear model. N=6. Asterisk indicates p<0.05.
Article Snippet: Cells were treated with recombinant (r) murine (m) or
Techniques: Recombinant, Western Blot, Binding Assay, Negative Control, Staining, Fluorescence, Isolation, Cell Culture

Journal: bioRxiv
Article Title: Network-based prioritisation and validation of novel regulators of vascular smooth muscle cell proliferation in disease
doi: 10.1101/2023.08.25.554834
Figure Lengend Snippet: (A) Number and size of clonally expanded patches formed by lineage labelled VSMCs from Myh11-Confetti animals, treated with 500 ng/mL recombinant TIMP1 or equimolar amount of N-TIMP1 tracked over 21 days of culture. Statistical significance assessed via generalised linear model. N=4. (B) Representative image of CD74 immunostaining (magenta) in lineage labelled mouse carotids 10 days post ligation of Myh11-Confetti animals. Magnified panels also show DAPI counterstained nuclei (top: merge of Confetti signals, CD74 and DAPI, middle: DAPI and RFP, lower: DAPI and CD74). White pointers marks CD74/RFP double positive cells. N=5 animals. Scale bar=100 µm (overview), 30 µm (zoomed view) (C) Representative image of murine VSMCs treated with 500 ng/mL recombinant murine (rm) TIMP1 four days post isolation and immunostained for pSTAT3 (S727, red) and CD74 (green). Nuclei are counterstained with DAPI (blue). Red pointer marks a STAT3 high cells, arrowhead points to a STAT3 low cell in merged and individual channels. (D) Quantification of cellular CD74 levels in panel C, stratified by high or low nuclear pSTAT3 intensity. N=4 animals, 4 repeats of each. Statistical significance was determined via student t-test. (E) Number and size of clonally expanded patches formed by lineage labelled VSMCs from Myh11-Confetti animals, treated with 500 ng/mL rmTIMP1 and/or a CD74 blocking antibody or peptide. (F) Representative western blot of serum started control human VSMCs (hVSMCs, UT), and cells treated for 5 minutes with 500 ng/mL recombinant human TIMP1 with or without +/− pre-treatment with an antibody (CD74 ab) or a peptide (CD74 pep) that blocks CD74. ( G ) Densitometric quantification of panel F. N=4 hVSMC isolates. ( H ) Representative immunohistochemistry image of CD74 in non-plaque human aorta. αSMA = blue, CD74 = brown. Scale bar=500 µm (overview) and 100 µm (zoomed view). N=7. (I) Representative images of RNA in situ hybridization for ACTA2 (green), TIMP1 (blue) and CD74 (red) in healthy human aorta, and plaque containing carotid. Blue arrows denote TIMP1 / ACTA2 + cells, red arrows denote CD74 / ACTA2 +cells. ( J ) Quantification of the % of ACTA2 positive cells also expressing TIMP1 or CD74 in the medial layer of non-plaque aorta (Healthy media) or in medial (Media Under Plaque) or Plaque regions of carotid endarterectomy samples (N=4 for each condition).
Article Snippet: Cells were treated with recombinant (r) murine (m) or
Techniques: Recombinant, Immunostaining, Ligation, Isolation, Blocking Assay, Western Blot, Immunohistochemistry, RNA In Situ Hybridization, Expressing
Journal: Cancer research
Article Title: LOXL2-mediated matrix remodeling in metastasis and mammary gland involution
doi: 10.1158/0008-5472.CAN-10-2868
Figure Lengend Snippet: (A) Western blot analysis of LOXL2 protein expression and TIMP1 in concentrated CM from 4T1/MDA-MB-231 cells expressing control or LOXL2 shRNA constructs, or transfected with siLOXL2 (compared with mock-transfected control).
Article Snippet:
Techniques: Western Blot, Expressing, shRNA, Construct, Transfection
Journal: Physiological Reports
Article Title: Posttranslational regulation of tissue inhibitor of metalloproteinase-1 by calcium-dependent vesicular exocytosis
doi: 10.1002/phy2.125
Figure Lengend Snippet: Effects of BAPTA/AM and nocodazole on TIMP-1 secretion. Media were collected from LX-2 cells 30 min after no treatment or treatment with (A) BAPTA/AM (50 μmol/L) and/or (B) nocodazole (20 μmol/L). TIMP-1 levels were determined by ELISA and for (B) normalized to baseline TIMP-1 secretion. BAPTA/AM and nocodazole decreased TIMP-1 secretion to ∼40–75% of baseline (* P < 0.05; ** P < 0.01), and the effects of BAPTA/AM and nocodazole were not additive. Furthermore, nocodazole did not reduce TIMP-1 secretion beyond that of BAPTA/AM alone ( P = 0.12). ( n ≥ 3 for each condition).
Article Snippet: For total internal reflection fluorescence (TIRF) microscopy experiments, a commercially available plasmid encoding Turbo-green fluorescence protein (GFP) fluorescent probe attached to the C-terminus of
Techniques: Enzyme-linked Immunosorbent Assay

Journal: Physiological Reports
Article Title: Posttranslational regulation of tissue inhibitor of metalloproteinase-1 by calcium-dependent vesicular exocytosis
doi: 10.1002/phy2.125
Figure Lengend Snippet: Rapid decreases in TIMP-1 release are not mediated by changes in TIMP-1 transcription. LX-2 cells were either left untreated or treated with the calcium chelator BAPTA/AM (50 μmol/L) or the Ca 2+ i agonist hormone vasopressin (2 μmol/L). Changes in TIMP-1 mRNA were determined by real-time RT-PCR. No differences in TIMP-1 mRNA levels were noted at the 30 min time point. Interestingly, both VP and BAPTA/AM increased TIMP-1 mRNA levels at 12 h ( n = 5 for each condition; * P < 0.05).
Article Snippet: For total internal reflection fluorescence (TIRF) microscopy experiments, a commercially available plasmid encoding Turbo-green fluorescence protein (GFP) fluorescent probe attached to the C-terminus of
Techniques: Quantitative RT-PCR

Journal: Physiological Reports
Article Title: Posttranslational regulation of tissue inhibitor of metalloproteinase-1 by calcium-dependent vesicular exocytosis
doi: 10.1002/phy2.125
Figure Lengend Snippet: LX-2 cells transfected with TIMP-1-DsRed exhibit temporally related Ca 2+ i signals and loss of DsRed fluorescence. (A) Representative images. Unlike the distribution of DsRed seen in Figure , TIMP-1-DsRed trafficked to discrete regions within LX-2 cells in a vesicular pattern. VP induced intracellular Ca 2+ i signals similar to those seen in Figure ; however, in addition, VP induced a decrease in TIMP-1-DsRed fluorescence. 400× magnification. (B) Graphical representation of changes in Fluo-4/AM calcium indicator and DsRed fluorescence. Changes in fluorescence were determined as described in Figure . VP again induced a sustained Ca 2+ i increase, which was followed by a marked decrease in DsRed fluorescence over the subsequent 20–60 sec. (C) Representative images. Serial TIRF microscopy images of transiently transfected LX-2 cells with TIMP-1-GFP also suggest that intracellular distribution of TIMP-1-GFP proteins follows a vesicular pattern observed at the subplasmalemmar levels. Pseudocolored frames corresponding to various time points post VP stimulation ( t = 1 min, green; t = 6 min, red; t = 15 min, cyan; t = 26 min, magenta) were combined to produce the composite image labeled as “ merged frames ”. The latter image shows areas where moving (arrows) and stable (arrowheads) TIMP-1-GFP vesicles were observed. 400× magnification.
Article Snippet: For total internal reflection fluorescence (TIRF) microscopy experiments, a commercially available plasmid encoding Turbo-green fluorescence protein (GFP) fluorescent probe attached to the C-terminus of
Techniques: Transfection, Fluorescence, Microscopy, Labeling

Journal: Physiological Reports
Article Title: Posttranslational regulation of tissue inhibitor of metalloproteinase-1 by calcium-dependent vesicular exocytosis
doi: 10.1002/phy2.125
Figure Lengend Snippet: VP-sensitive decreases in TIMP-1-DsRed fluorescence were inhibited by calcium chelation. Aggregate changes in DsRed fluorescence ( n = 5 per condition) were determined in LX-2 cells transfected with DsRed (control) or TIMP-1-DsRed ± BAPTA/AM (50 μmol/L). The VP-sensitive decrease in DsRed fluorescence in LX-2 cells expressing TIMP-1-DsRed (* P < 0.001) was inhibited by pretreatment with BAPTA/AM.
Article Snippet: For total internal reflection fluorescence (TIRF) microscopy experiments, a commercially available plasmid encoding Turbo-green fluorescence protein (GFP) fluorescent probe attached to the C-terminus of
Techniques: Fluorescence, Transfection, Expressing

Journal: Physiological Reports
Article Title: Posttranslational regulation of tissue inhibitor of metalloproteinase-1 by calcium-dependent vesicular exocytosis
doi: 10.1002/phy2.125
Figure Lengend Snippet: TIMP-1 colocalizes with microtubules but not microfilaments in LX-2 cells. (A) Confocal immunofluorescence comparing distribution of endogenous TIMP-1 and α -tubulin. Localized expression of TIMP-1 and α -tubulin were determined in untransfected LX-2 cells by confocal immunofluorescence. (a) TIMP-1 fluorescence is pseudocolored red, α -tubulin fluorescence is pseudocolored green, and nuclear staining (TO-PRO) is pseudocolored blue. Focused images at the plasma membrane, either closer to the nucleus (b–d insets) or in cell extensions (e–g insets) demonstrate that endogenous TIMP-1 is concentrated in a vesicular pattern colocalizing with α -tubulin. (a) 630× magnification, (b–g) 3× zoom-in from the (a) picture. (B) Confocal immunofluorescence comparing distribution of endogenous TIMP-1 and F-actin. Localized expression of TIMP-1 and actin microfilaments were determined in untransfected LX-2 cells by confocal immunofluorescence. (a) TIMP-1 fluorescence staining is pseudocolored red, and tetramethylrhodamine-phalloidin fluorescence staining is pseudocolored green. Unlike in the left image, TIMP-1 does not appear to colocalize with filamentous actin in the perinuclear cytoplasm (b–d insets) or in cell extensions (e–g insets). (a) 630× magnification, (b–g) 3× zoom-in from the (a) picture. (C) Confocal immunofluorescence comparing distribution of endogenous TIMP-1 versus exogenous TIMP-1-GFP. LX-2 cells were transfected with a TIMP-1-GFP (green) expression vector, immunolabeled with anti-TIMP-1 (red), and stained with DAPI nuclear dye (blue). All TIMP-1-GFP proteins (b) are also labeled with anti-TIMP-1, and the majority of the vesicles observed are at or near the plasma membrane or perinuclear cytoplasm (a,b,d). Interestingly, native TIMP-1 is also noted in a vesicular pattern in an intermediate region (a,c). (a) 400× magnification, (b,c, and d) 3× zoom-in from the (a) picture. (D) Confocal immunofluorescence comparing distribution of TIMP-1-GFP and F-actin. LX-2 cells were transfected with a TIMP-1-GFP (green) expression vector and stained with tetramethylrhodamine-phalloidin (red) (a). TIMP-1-GFP-containing vesicles in the peri-nuclear cytoplasm do not colocalize with phalloidin-stained F-actin (a); however, there is near or colocalization in the region of the plasma membrane (c–d). (a) 400× magnification, (b,c, and d) 3× zoom-in from the (a) picture. (E) Confocal immunofluorescence comparing distribution of TIMP-1-GFP and α -tubulin. LX-2 cells were transfected with a TIMP-1-GFP (green) expression vector and immunolabeled with anti- α -tubulin (red) (a). No colocalization between TIMP-1-GFP and α -tubulin was observed (b–d). (a) 400× magnification, (b,c, and d) 3×zoom-in from the (a) picture. (F) Immunoblot to determine specificity of TIMP-1 antibody. The TIMP-1 antibody used for the immunofluorescence figures above was used to determine the expression of TIMP-1 in LX-2 cells transfected with TIMP-1-DsRed. The TIMP-1 antibody recognizes a 25-kDa band, representing native (or wild type) TIMP-1 (white arrowhead), and a 55–65 kDa band, representing expressed TIMP-1-DsRed fusion protein (black arrowhead). The relative intensities of these bands suggest that the majority of TIMP-1 expression in transfected LX-2 cells is exogenous.
Article Snippet: For total internal reflection fluorescence (TIRF) microscopy experiments, a commercially available plasmid encoding Turbo-green fluorescence protein (GFP) fluorescent probe attached to the C-terminus of
Techniques: Immunofluorescence, Expressing, Fluorescence, Staining, Transfection, Plasmid Preparation, Immunolabeling, Labeling, Western Blot

Journal: Physiological Reports
Article Title: Posttranslational regulation of tissue inhibitor of metalloproteinase-1 by calcium-dependent vesicular exocytosis
doi: 10.1002/phy2.125
Figure Lengend Snippet: Effects of microtubules, microfilaments, and atypical myosins inhibition on TIMP-1 exocytosis. Changes in VP-sensitive decreases in TIMP-1-DsRed fluorescence were determined in LX-2 cells pretreated with either nocodazole (20 μmol/L) for 30–60 min, cytochalasin D (2 μmol/L) for 1–2 h or varying concentrations of blebbistatin (5–100 μmol/L) for 30 min ( n = 4–5 for all experiments). (A) Effect of microtubules inhibitor nocodazole. Nocodazole completely inhibited VP-sensitive TIMP-1-DsRed exocytosis at 30–60 min ( n = 5 for all groups; P < 0.01). (B) Effect of microfilaments inhibitor cytochalasin D. Cytochalasin D partially inhibited VP-sensitive TIMP-1-DsRed exocytosis at 1 h (* P < 0.01 vs. control; % P = 0.521 vs. control) and completely inhibited VP-sensitive TIMP-1-DsRed exocytosis at 2 h. (C) Effect of atypical myosins inhibitor blebbistatin. Blebbistatin had no effect on VP-sensitive TIMP-1-DsRed exocytosis at 5 μmol/L but blocked TIMP-1-DsRed exocytosis at 50 μmol/L and 100 μmol/L.
Article Snippet: For total internal reflection fluorescence (TIRF) microscopy experiments, a commercially available plasmid encoding Turbo-green fluorescence protein (GFP) fluorescent probe attached to the C-terminus of
Techniques: Inhibition, Fluorescence
Journal: Biological Chemistry
Article Title: Exogenously added GPI-anchored tissue inhibitor of matrix metalloproteinase-1 (TIMP-1) displays enhanced and novel biological activities
doi: 10.1515/bc.2004.081
Figure Lengend Snippet: Figure 1 Generation and purification of GPI-anchored TIMP-1. (A) The GPI-anchored TIMP-1 was overexpressed in CHO cells. The FACS plot of stably transfected CHO cells using an anti-human TIMP-1 monoclonal antibody is shown. (B) In parallel to the experiment shown in (A), TIMP-1-GPI expressing CHO cells were treated with 60 ng/ml phosphatidylinositol-specific phospholipase C for 30 min before FACS analysis using the anti-human TIMP-1 antibody. (C) The GPI-anchored TIMP-1 CHO cells were treated with 0, 30, 60, 120 ng/ml phosphatidylinositol-specific phospholipase C in serum-free media for 30 min at 378C. TIMP-1 was measured in the supernatant using a human TIMP-1-specific ELISA kit. Data represent the mean of ns3 experiments. (D) Outline of the procedure used to purify the TIMP-1-GPI protein from the CHO overex- pressing cells using fast protein liquid chromatography (FPLC). Protein was detected by silver stain and human TIMP-1 protein by Western blotting using an anti-human TIMP-1 monoclonal antibody. The fraction numbers listed for the silver stain and Western blot each represent 0.25 ml of the size exclusion column from 5.25 to 7.5 ml.
Article Snippet: Coating anti-human TIMP-1
Techniques: Purification, Stable Transfection, Transfection, Expressing, Enzyme-linked Immunosorbent Assay, Fast Protein Liquid Chromatography, Silver Staining, Western Blot